Saturday, April 24, 2010
Lab 4: Introducing ArcMap
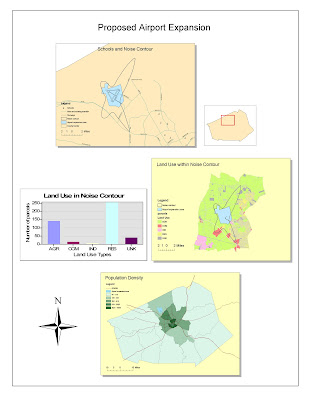
My first experience with ArcMap was made very simple and straightforward by the given tutorial. Parts one and two both took about two hours each of simply following step-by-step directions. I was able to combine existing maps with spatial data to output a GIS model of a particular airport expansion project. Many aspects of the program, such as the use of layers and the organization of files, reminded of other programs such as Photoshop and SolidWorks. Before working on this project, I had no idea that there was such powerful and fully-featured modeling software made just for GIS. I can definitely see its value in effectively creating a robust GIS model, and allowing its fast distribution and easy editing if needed.
One of the most important functions of ArcMap is to propose and to answer complicated GIS questions. For this particular lab, the general question on the feasibility of a proposed airport expansion project can be answered by applying various sets of spatial data onto a visual model that anyone can easily understand. For example, the most significant drawback of the project, the increase in the noise level in the area, is represented by a noise contour on the county map. We then overlaid additional layers containing schools in the area, land use, and population density, in order to determine if the expansion significantly affects any schools, residential zones, or large groups of the county population.
ArcMap allows the addition of all the necessary legends and scales to completely show the information. Different tables, graphs, and colors are used to clearly present data. Within the noise contour there is one school and a significant residential population. Then it would be up to local government officials to compare this GIS data with local laws and regulations to make a decision. As we can see, the strength of ArcMap comes in its ability to analyze and organize a lot of spatial data onto a map, while retaining the flexibility to edit and add data on the fly. The program is very polished, allowing the use of many of these features to show GIS information, while remaining very stable and fast. It is definitely made with professional maps and large quantities of data in mind.
However I believe that ArcMap's biggest advantage, its many features and functions, is also its biggest pitfall. The menu-based user interface can be very complicated for casual users. The sheer amount of layers that one has to keep track of can get confusing. And the saving system and file extensions are additional details that a user has to keep in mind. A casual user simply cannot pick up the program and start using it as a neogeography tool for their daily lives. This makes it necessary for a professional user to take an in-depth tutorial or class in order to take advantage of all its quirks and features, which limits the widespread use of the program to only within the GIS field and related industries.
Monday, April 19, 2010
Lab 3: Neogeography
View Basketball courts in the San Fernando Valley in a larger map
This dynamic map, made using Google Maps, provides information on the various public basketball courts in the San Fernando Valley. My buddies and I have always wished we had a tool like this to find alternative basketball facilities, because the courts that we frequent are always packed with too many people. I have divided the basketball courts into three categories: blue for indoor courts, green for outdoor courts, and red for both indoor and outdoor courts. It is interesting to note that in the approximately 260 square miles (670 square kilometers) of the San Fernando Valley, there are over 50 public basketball facilities that I know of. That's at least 1 public court for every 5 square miles. As expected about 50% of those are outdoor courts because they are the cheapest and easiest to build. Most of my friends prefer the springy hardwood indoor courts over the rough concrete outdoor courts, however it is very convenient to be knowledgeable of all our options.
Convenience is the biggest asset that neogeography brings to the table, because without a doubt it saves time and money for everyone. Consumers save time searching for places to conduct their business, and save money when details like price and quality are provided. Business owners cut down the time it would take to penetrate their local markets, and they save money on the marketing and advertising they would have needed to do so. This kind of convenience facilitates economic growth, while cutting down on the inefficiencies and delays that used to be common in the past.
However, this is not to say that neogeography is without its disadvantages. Perhaps it makes it too easy for individuals to find what they are searching for. Before the advent of online maps and portable GPS devices, learning how to read paper maps and understand verbal directions was a skill that every person absolutely had to learn. Nowadays, a person guided by such devices can drive vast distances without even the slightest idea of his or her position or direction on the road. I admit that I myself have become a fan of GPS applications on my phone, but I just cannot help but think that this kind of overdependence on them only furthers the sense of isolation and personal disconnect that technology has brought in the last few decades. What will happen when the internet and the GPS satellites fail?
Wednesday, April 7, 2010
Lab 2: USGS Topographic Maps
1. What is the name of the quadrangle?
Beverly Hills Quadrangle
2. What are the names of the adjacent quadrangles?
Canoga Park, Van Nuys, Burbank, Topanga, Hollywood, Venice, and Inglewood
3. When was the quadrangle first created?
1966
4. What datum was used to create your map?
National Geodetic Vertical Datum of 1929
5. What is the scale of the map?
1:24000
6. At the above scale...
a) 5 centimeters on the map to meters on the ground?
1200 meters
b) 5 inches on the map to miles on the ground?
1.89 miles
c) One mile on the ground to inches on the map?
2.64 inches
d) Three kilometers on the ground to centimeters on the map?
12.5 centimeters
7. What is the contour interval on your map?
20 feet
8. What are the approximate geographic coordinates of...
a) the Public Affairs Building
34° 4' 27" and 118° 26' 18"
34.074° and 118.438°
b) tip of Santa Monica pier
34° 0' 26" and 118° 29' 57"
34.007° and 118.499°
c) the Upper Franklin Canyon Reservoir
34° 6' 11" and 118° 24' 46"
34.103° and 118.413°
9. What is the approximate elevation in both feet and meters of...
a) Greystone Mansion
560 feet
b) Woodlawn Cemetery
140 feet
c) Crestwood Hills Park
620 feet
10. What is the UTM zone of the map?
Zone 11
11. What are the UTM coordinates for the lower left corner of your map?
3615000 mEasting, 3763000 mNorthing
12. How many square meters are contained within each cell of the UTM gridlines?
1,000,000 square meters
13. Create an elevation profile along UTM northing 3771000.
14. What is the magnetic declination of the map?
14° East
15. In which direction does water flow in the stream between the 405 and Stone Canyon Reservoir?
From North to South
16. Crop out UCLA from the map.
Subscribe to:
Posts (Atom)